top of page


Yield Giants
US - Lebensversicherungen
Produkte / Investitionspotential
Immobilienentwicklung in London
Prozessfinanzierung
Vereinigtes Königreich
US-Lebensversicherungen
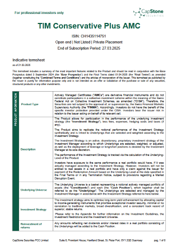
Conservative Plus AMC (max. 50% Quote)
HPF - Anlagefonds von einer Drittpartei
Min Zeichnung
EUR 10k resp. CHF 5k
(oder Mehrfaches)


Yield Giants – US-Lebensversicherungen
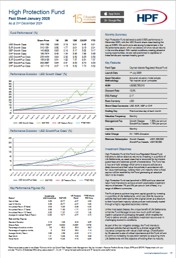
Track Record HPF per 31. Dezember 2024*
HPF Performance – Fact Sheet Januar 2025 (per 31. Dezember 2024)
Class | Share Price | 1M | 3M | 12M | CAGR | YTD |
|---|---|---|---|---|---|---|
USD Growth Class | 349.176 | 0.69 | 2.16 | 9.21 | 8.45 | 9.21 |
EUR Growth Class | 313.1351 | 0.56 | 1.77 | 8.01 | 8.19 | 8.01 |
GBP Growth Class | 143.3626 | 0.69 | 2.16 | 9.17 | 9.32 | 9.17 |
CHF Growth Class | 156.7974 | 0.42 | 1.34 | 5.95 | 7.9 | 5.95 |
USD GrowthPlus Class | 235.4434 | 0.64 | 2.02 | 8.58 | 8.29 | 8.58 |
EUR GrowthPlus Class | 195.8189 | 0.51 | 1.62 | 7.37 | 8.31 | 7.37 |
GBP GrowthPlus Class | 202.2987 | 0.64 | 2.01 | 8.53 | 8.73 | 8.53 |
CHF GrowthPlus Class | 187.171 | 0.37 | 1.19 | 5.32 | 7.73 | 5.32 |
Metric | Investments (USD GrowthPlus) | S&P 500 | US Treasury Bond | FTSE World BIG Corp |
|---|---|---|---|---|
Year to Date | 8.58 | 23.77 | -2.37 | 0.93 |
Last 12 Months | 8.58 | 23.77 | -2.37 | 0.93
|
Annualised Return (5 Years) | 9.09 | 12.9 | -2.96
| -0.33 |
Annualised Return (7 Years) | 8.89 | 11.92
| -1.71 | 0.76 |
Annualised Return (10 Years) | 8.3 | 11.07 | -1.27 | 1.42 |
Average Annualised Rate of Return | 12.8 | 19.77 | -0.47 | 0.73 |
Standard Deviation | 0.16 | 4.28 | 6.03 | 9.25 |
Sharpe Ratio | 3.4677 | 0.2303 | -0.0097 | 1.6746 |
Percentage of positive months | 100.0 | 68.2
| 63.9 | 88.5 |
Percentage of negative months | 0.0 | 33.8 | 36.2 | 11.5 |
Average Monthly Return | 0.86 | 0.98 | -0.09 | 0.13 |
Best Month | 1.01 | 12.68 | 4.3 | 5.85 |
Worst Month | 0.0 | -13.23 | -4.16 | -6.94 |
* Performance data quoted is net of fees
bottom of page


